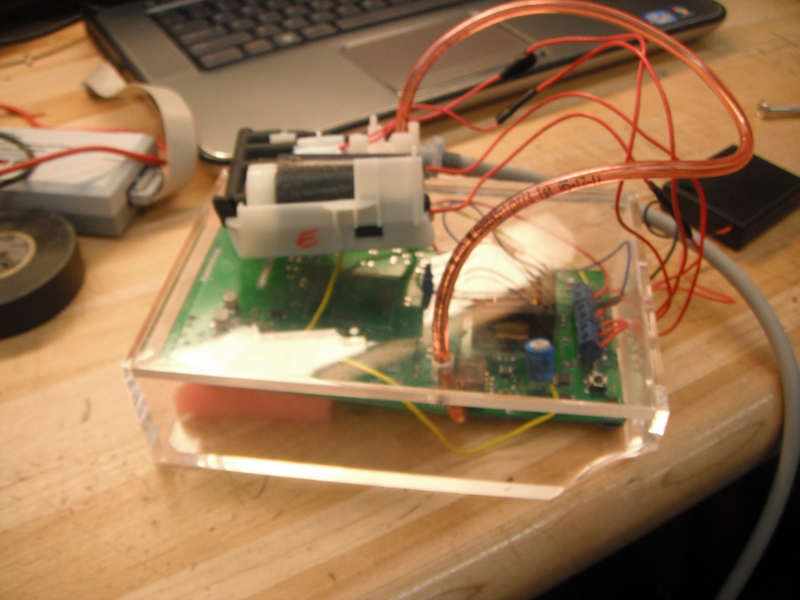
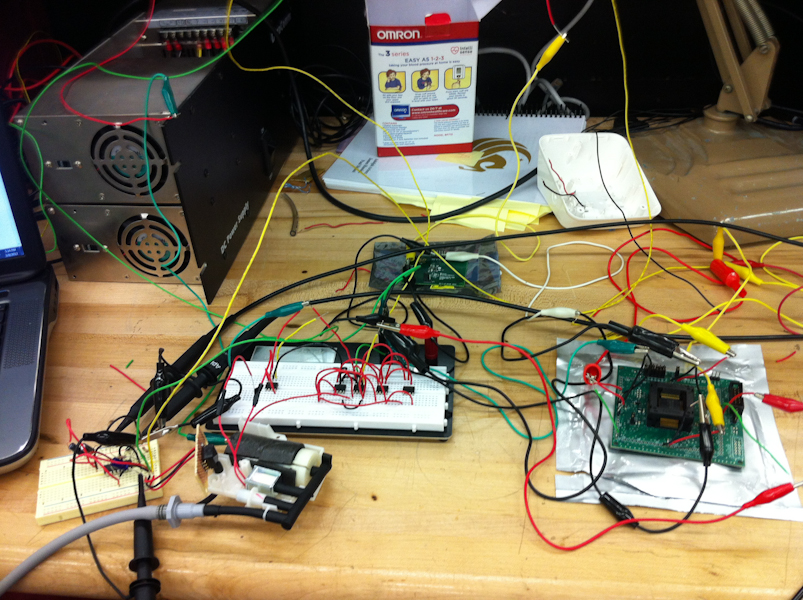
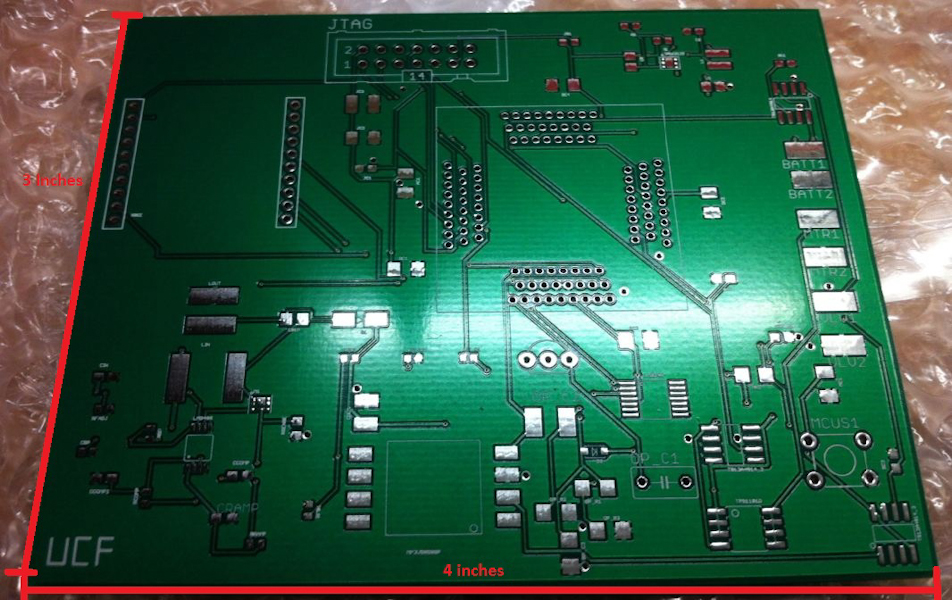
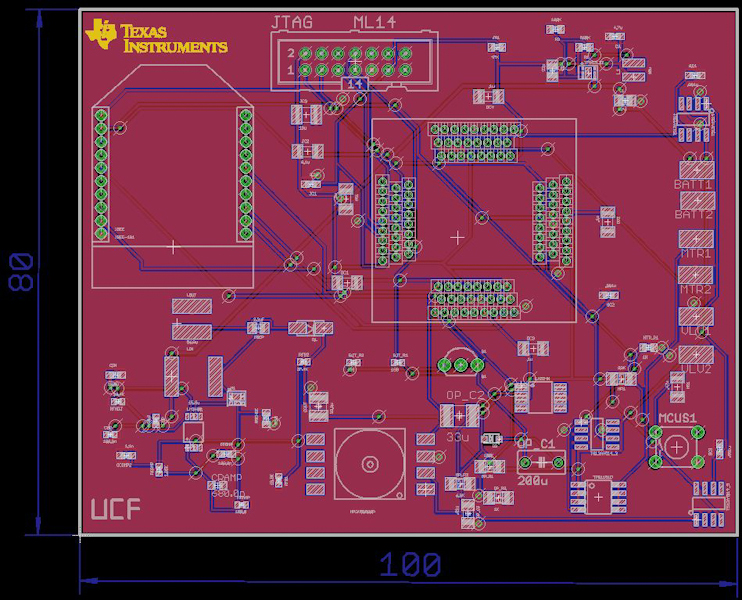
Photos:


Videos:
Video Description
- The yellow line (top) represents the peak detection.
- The purple line (middle) represents the oscillation/pulse signal.
- The blue line (bottom) represents the cuff pressure decreasing.
Video Description
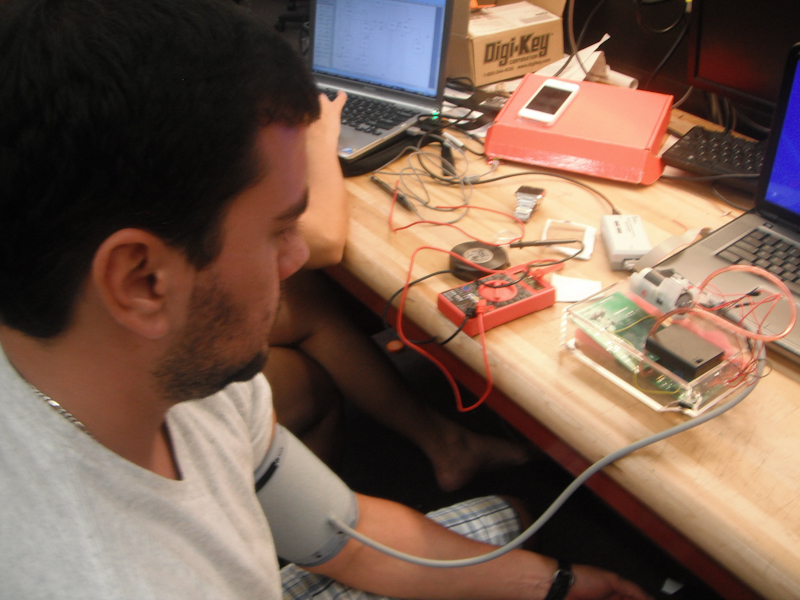
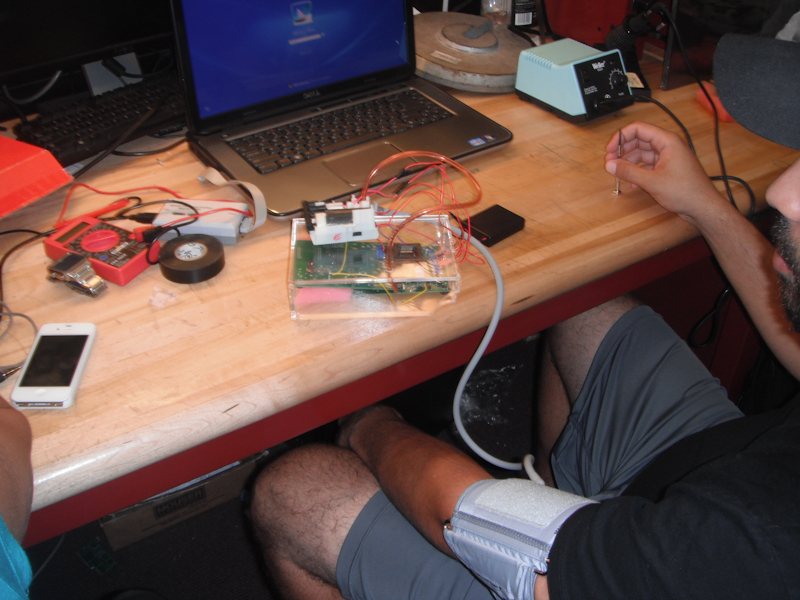
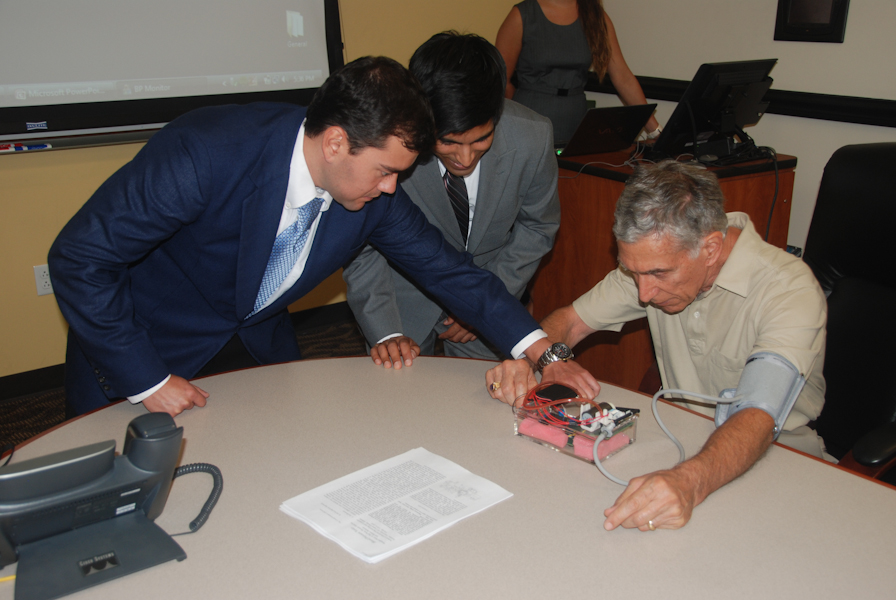
This video shows the Blood Pressure Tester working properly. Once the button is pushed the system will "start" the asterix on the computer screen represents the heart beats the sensor is sensing and once the screen says "Reading in Progress" the blood pressure calculations are being made (systolic/diastolic) and will be sent wirelessly to the PC.
Video Description
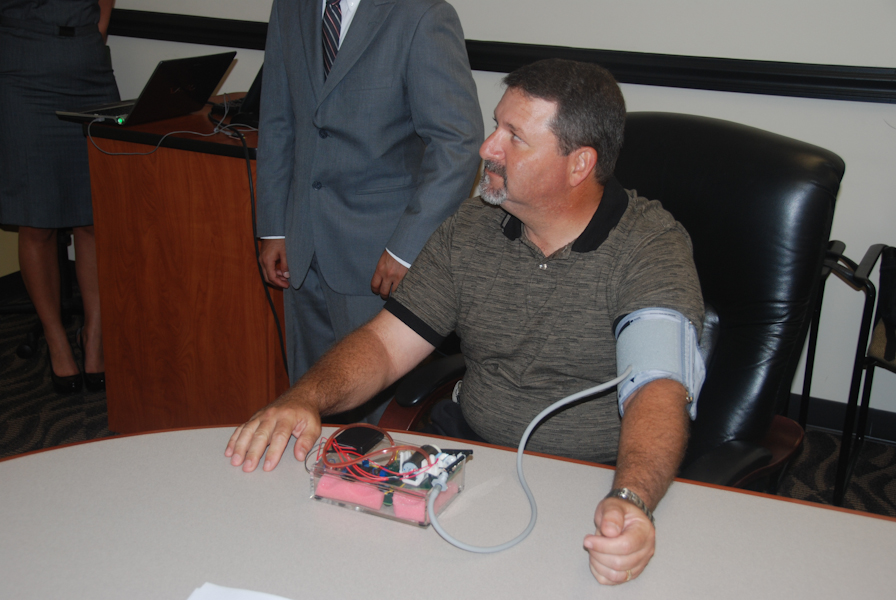
This Video shows the Blood Pressure Tester "aborting" or turning the system off once the system starts to calculate the blood pressure data and the patient makes a sudden movement to alter the calculations.