Pictures
| Click each picture to open the original size picture. |
|
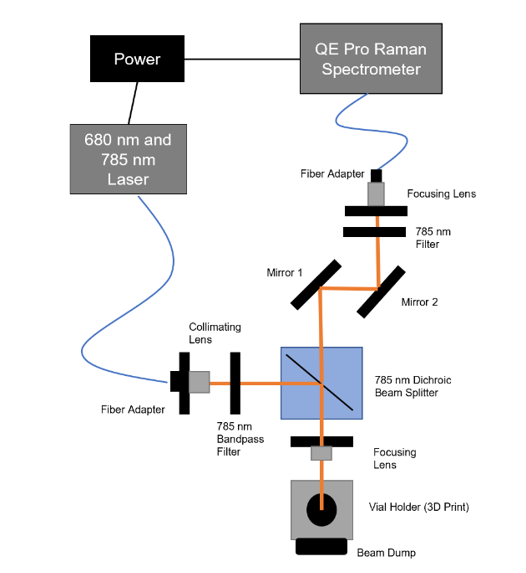 |
Optical Diagram |
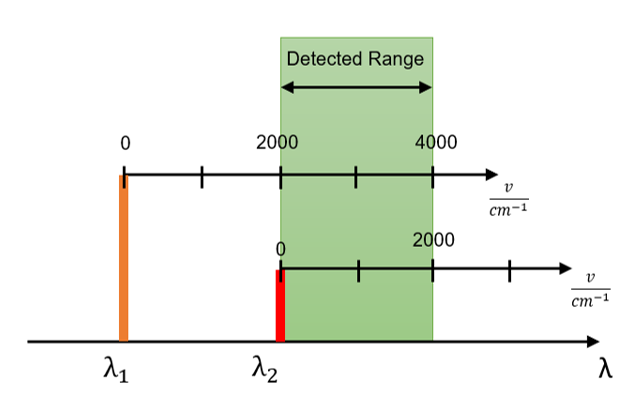 |
Detected range region |
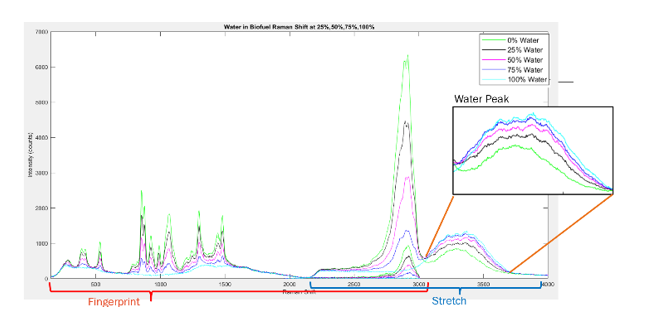 |
Spectra that displays the water peaks, as well as the difference between the fingerprint region (785nm) and the stretch region (680nm) |
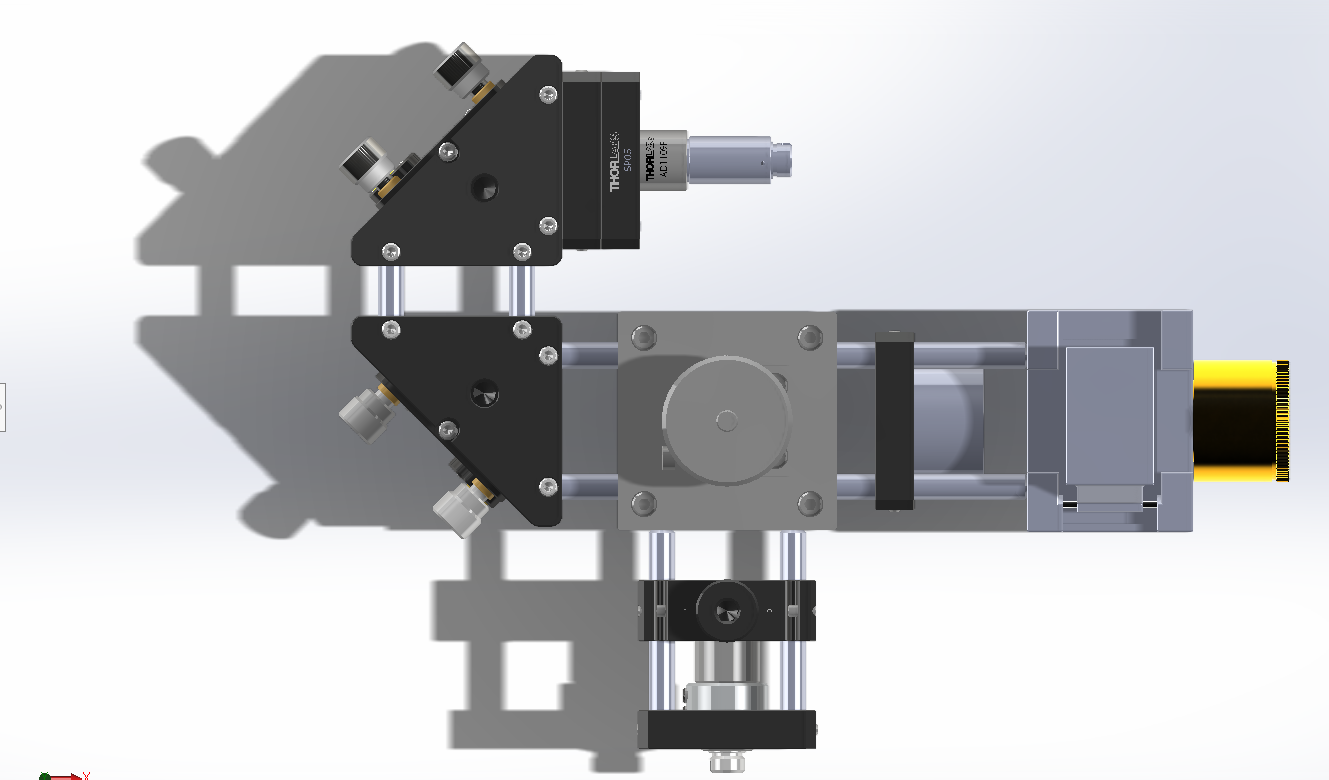 |
Solid Works simulation build of the optical cage (view 1) |
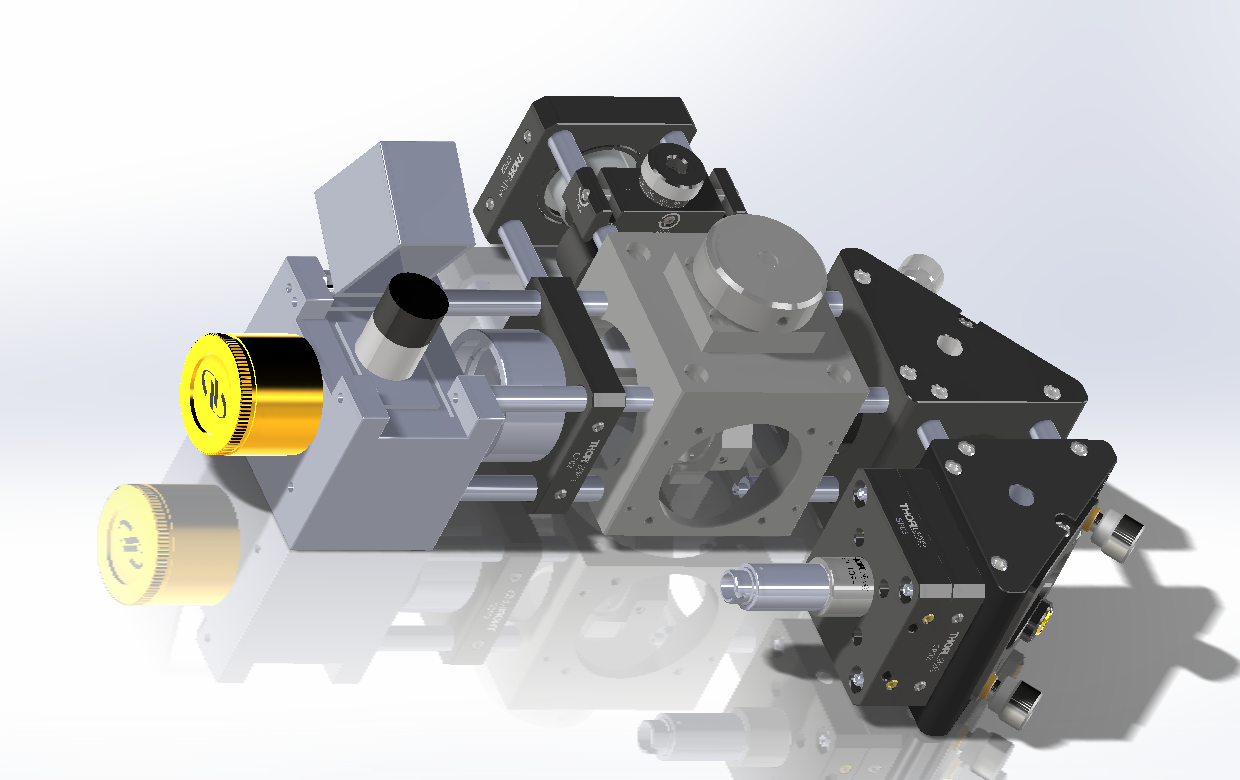 |
Solid Works simulation build of the optical cage (view 2) |
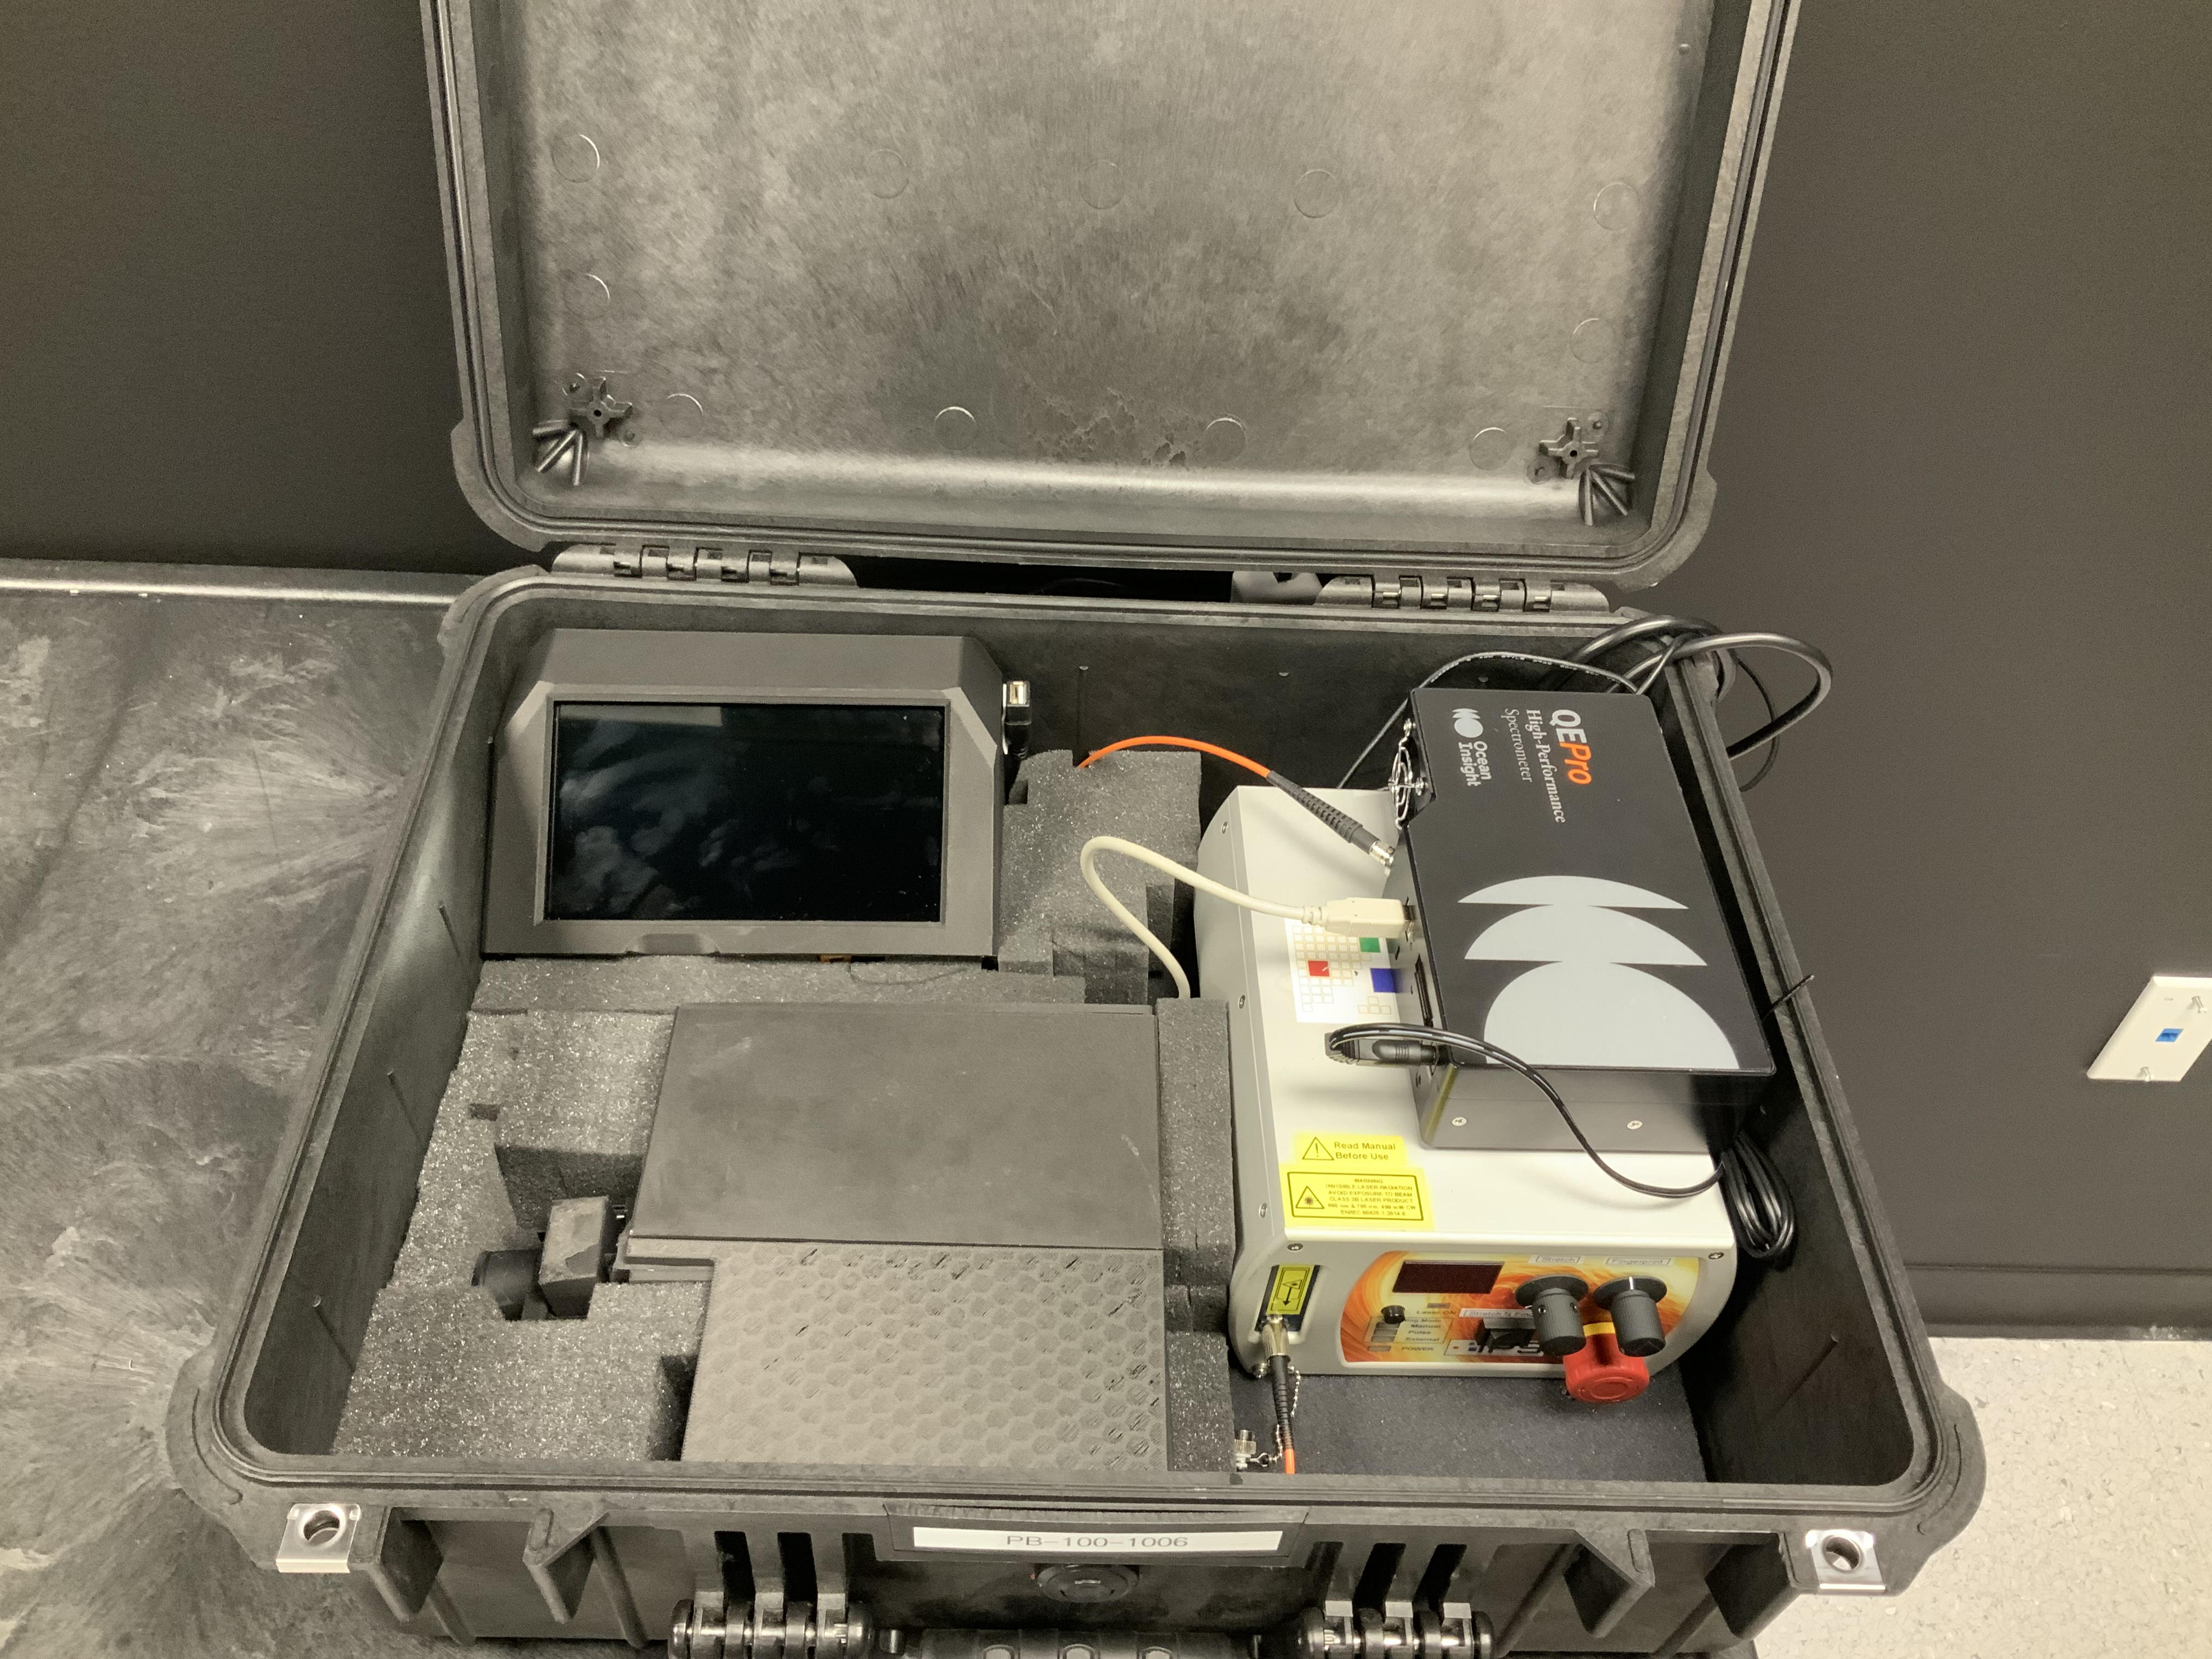 |
System fully built in Pelican Case |
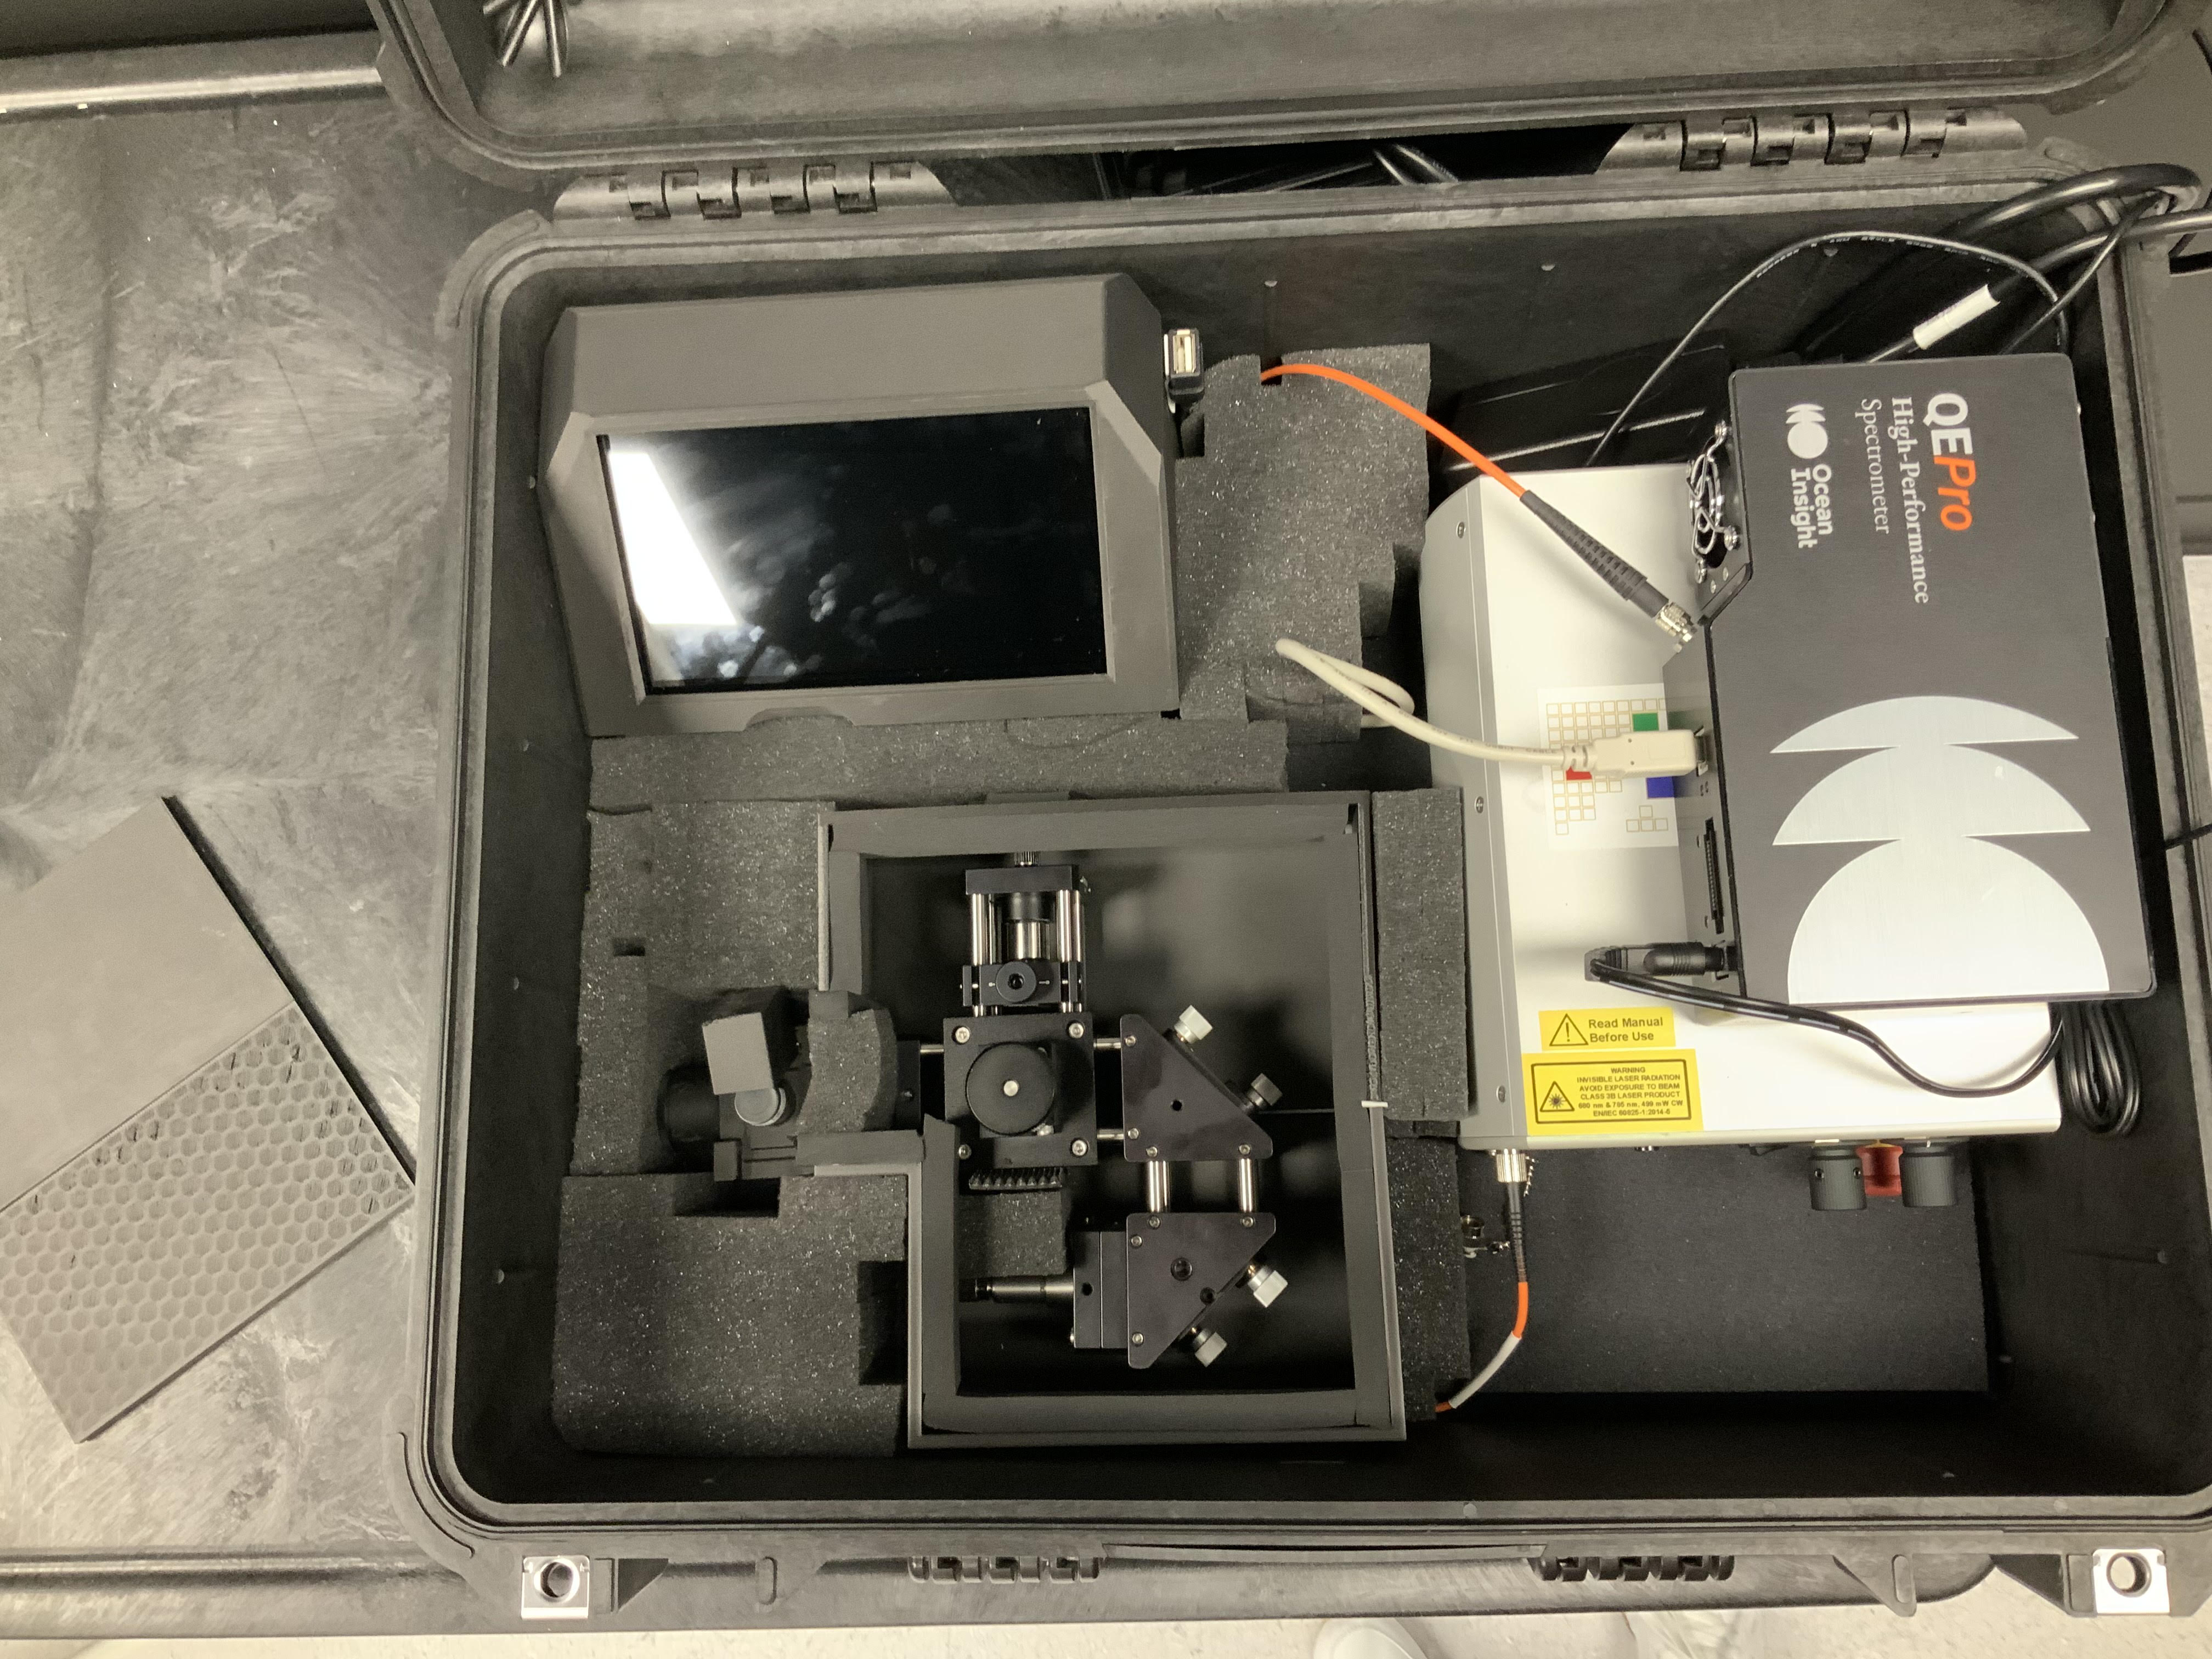 |
System fully built with opitcal internals shown |
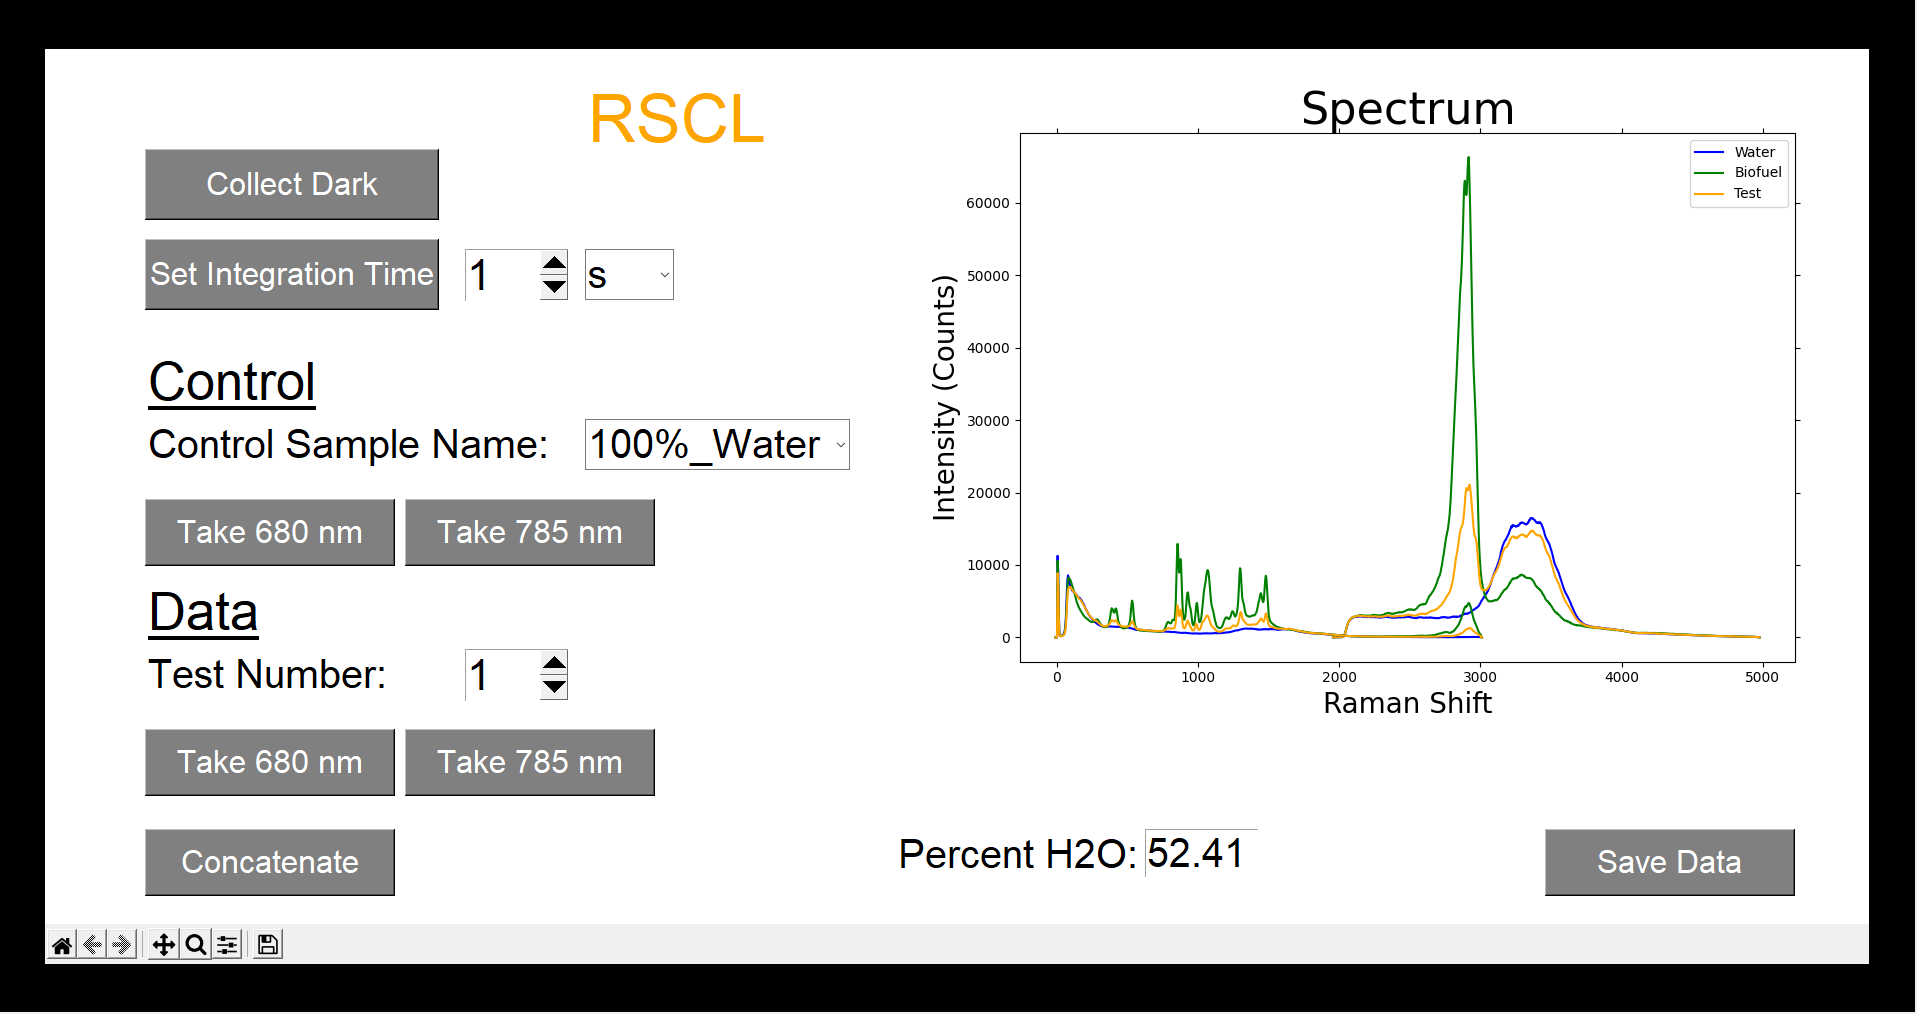 |
Screen Shot of the finished GUI |
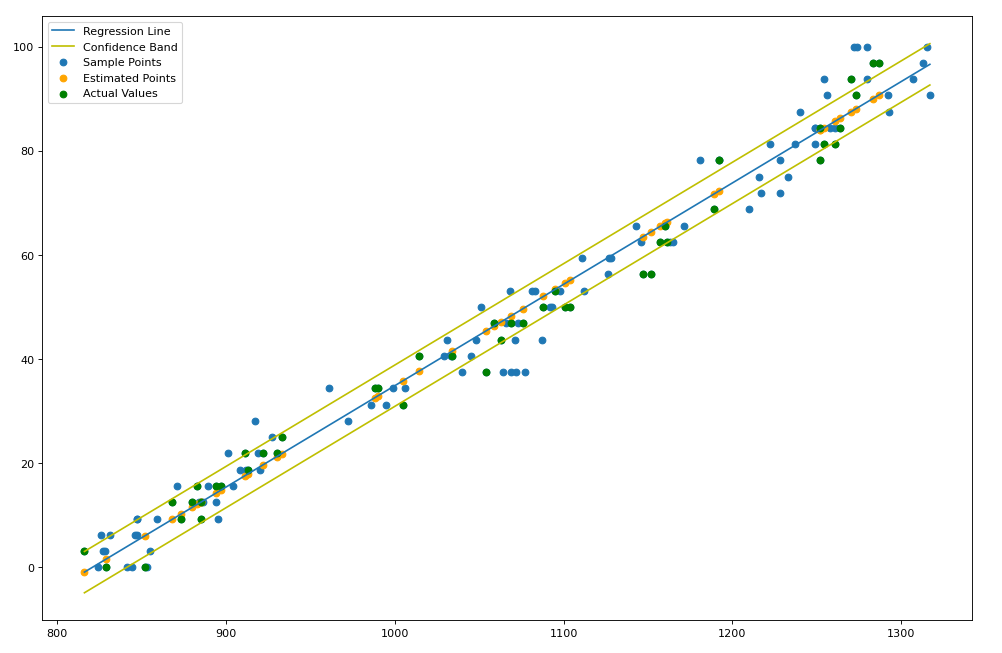 |
Calculated regression line |